
High-Energy Physics in Atmosphere: In Situ Measurements of the Runaway Breakdown (Rb) and Thunderstorm Ground Enhancements (TGEs) on Aragats Mountain
TGE - RREA RELATION
The
high-energy physics in the atmosphere is a new emerging scientific field
dealing with electromagnetic cascades originated in the thunderstorm
atmospheres. The initial name of the cascade released by a runaway electron-the
Runaway breakdown (RB, given by Gurevich et al., [1]), is recently often
replaced by the term RREA (Relativistic Runaway Electron Avalanches, [2,3]). The tripole model of the charge
structure of the cloud, along with the upper negative dipole, also contains the
lower positive dipole, which accelerates the electrons down to the ground. This
fundamentally changes Wilson's approach to observing runaway electrons apart of
thundercloud and implies placing particle detectors directly under the
thundercloud. But, oddly enough, observing the phenomena of runaway electrons
turned out to be a rather difficult task. The review from 1997 [4] noted:
"Summing up after 70 years of numerous theoretical and experimental studies, it
is still not clear whether the mechanisms of acceleration of runaway electrons
during a thunderstorm or lightning work". However, recent multisensory measurements on
Aragats of the enhanced particle fluxes allows validation of the RB/RREA model
and unambiguously prove that the origin of TGE is a RB/RRE avalanche developing
in the thundercloud above the detectors. The first observation of the
avalanches initiated by the runaway electrons was made at Aragats in 2009 [5].
MAKET and ASNT detectors (see supplement information in [6] for detector description)
were used for the in situ detection of RB/RREA process In Fig. 1, we present the time series of
1-minute particle count rates observed by ASNT detector on 19 September. The
flux started with slow surge, then rockets for 4 min to the maximal value and
then fast decays. This TGE is the largest ever-observed on Aragats. On 22:47
the upper scintillators of the ASNT detector registered 108% enhancement
corresponding to 270 standard deviations from the mean value (270𝜎);
the bottom scintillators registered 16% enhancement (60.7𝜎);
the near- vertical flux (coincidences
enhanced by 11.2% (16.8 𝜎).
In Fig. 2 we show particle flux enhancement
registered by the 4 identical 5 cm thick plastic scintillators located above
four 60 cm scintillators. Registered TGE particles flux was rather large ∼ 30,000 per
min per m2.
To prove the
atmospheric origin of the flux enhancement we check the direction of incoming
particles. As one can see in Fig. 3 particles come from near-vertical direction
(solid black curve with pronounced 4-minute duration peak), other directions
didn't demonstrate any enhancement other the background flux.
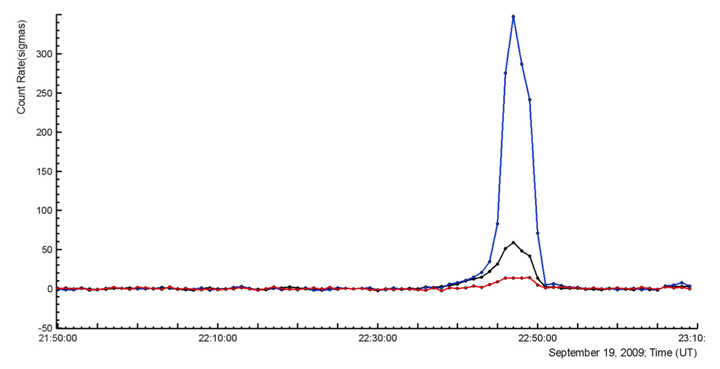
Figure 1. ‘‘Significance'' of TGE in the number
of standard deviations from the mean value of 1-minute time series of count
rate. Top curve corresponds to upper scintillators of the ASNT detector,
middle-to lower and the bottom-to vertical particle transition through both
scintillators.
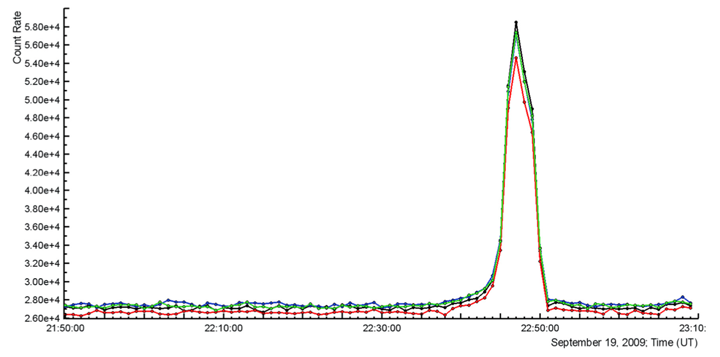
Figure 2. Particle flux enhancement as measured on 19 September 2009 by four 5 cm
thick 1 m2 area plastic scintillators on top of ASNT detector; energy threshold
∼ 7 MeV.
Another evidence of ‘‘thunderstorm'' origin
of particle flux comes from MAKET array's are 16 and 8-fold coincidences within
trigger window of 1 μs
(Fig. 4a and b). The electronics of the MAKET surface array counts number of
events per minute, in which particles hit 8 and 16 scintillators within a
window of 1 μs.
The abrupt enhancement of the coincidences occurred the same minutes when the
flux of particles surges (128 and 67 counts for 8- and 16-fold coincidences,
see Fig. 4b and a).
Figure 3. The
count rate of particles coming from different directions. The peak lasting 4
min is formed by particles coming from a near-vertical direction only (0-20◦, black curve, coincidences of scintillators
stacked vertically); the particles coming from the inclined directions
(coincidences of scintillators that are shifted from each other, see Fig. 1 of
supplement) do not show any enhancement.
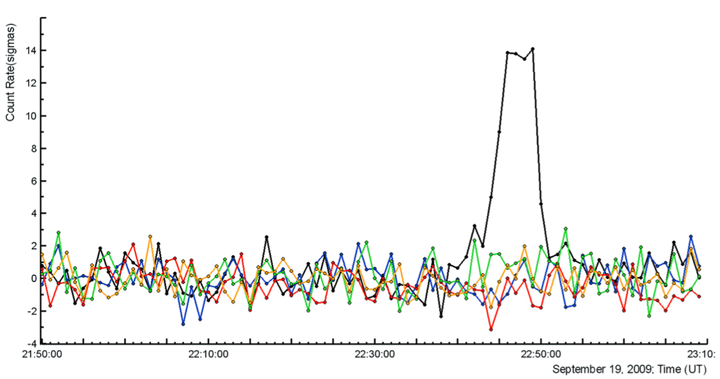
Figure 3. The count rate of
particles coming from different directions. The peak lasting 4 min is formed by
particles coming from a near-vertical direction only (0-20◦, black curve, coincidences of scintillators stacked vertically); the
particles coming from the inclined directions (coincidences of scintillators
that are shifted from each other, see Fig. 1 of supplement) do not show any
enhancement.
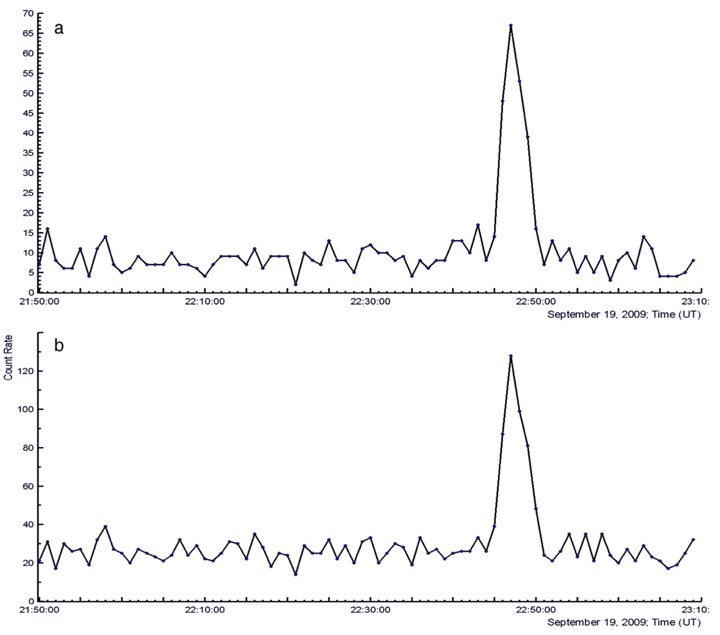
Figure 4. 8 and 16-fold
coincidences in the channels of MAKET surface array.
At fair weather (background counts), the
surface array registered ∼26.8 +/- 4.9 counts per minute (8-fold
coincidences) and ∼8.4 +/- 2.8 counts per minute (16 fold
coincidences). Thus at 22:47 MAKET array observed ∼730%
enhancement of the 16-fold coincidences, corre- sponding to ∼22𝜎 and
380% enhancement of the 8-fold coincidences, corresponding to ∼20𝜎.
Numerous ‘‘Extensive cloud showers'' (ECSs, or Micro Runway Breakdowns-MRB,
[7]) enhance the stable count rate of EASs generated by galactic cosmic rays.
Both processes EAS and ECS independently contribute to the MAKET array count
rate. The minutes long enhanced particle flux comprises from multiple ECSs
initiated by a runaway electrons randomly injected into the strong electrical
field region. In Fig. 5a and b we demonstrate the distribution of the
registered by MAKET array showers during fair weather and during the minute
when maximal flux was detected correspondingly.
The significant excess in shower number
observed this minute (∼100, Fig. 5b) comparing with showers
observed during fair weather (Fig. 5a) is due to randomly distributed within
this minute ECSs, several times occurred in triplets and quadruplets per
second, but never more. If the RB process will be self-consistent i.e. the RREA
will not stop and continuously generate showers via feed back positrons and
scattered gamma rays (RDFM model, [2]) we should observe much more counts of
ECSs. The maximal dead time of the MAKET array is 100 μs; thus after
each 100 μs
another shower can be registered by the surface particle array. Therefore, we
can expect up to 10,000 showers per second (if the RDFM process prolongs 1 s),
however, we register not more than 4.
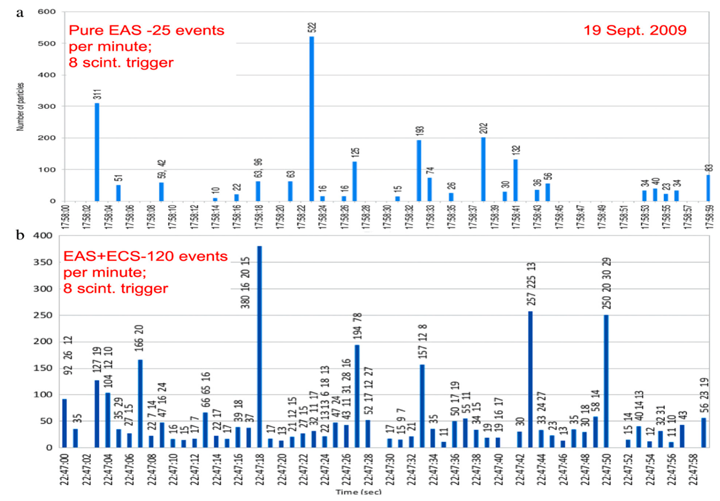
Figure 5. Particle showers
(EASs) detected during 60 s of the fair weather (a) and during a thunderstorm
at maximal particle flux (EASs +ECSs) (b). Vertical bars show the number of
particles in showers. If there were more than one shower in a second the height
of a bar is equal to the size (number of particles) of the largest shower, next
number after an interval is the number of particles in the next ECS, and so on.
Note that maximal number of ECSs in a second is 4.
ENERGY RELEASE SPECTRA
ASNT data acquisition system registers
energy release histograms both for events with and without veto i.e., if we
have a signal in 5 cm thick scintillator the measured energy release is
‘‘vetoed'' and do not participate in the histogram. In this way, we obtained
the energy spectra of the neutral particles i.e. TGE gamma rays, originated
from bremsstrahlung of accelerated in the RB process electrons (Fig. 6). In
addition, extracting histogram obtained with veto from the histogram obtained
without veto we readily come to the histogram of electron energy releases (Fig.
6).
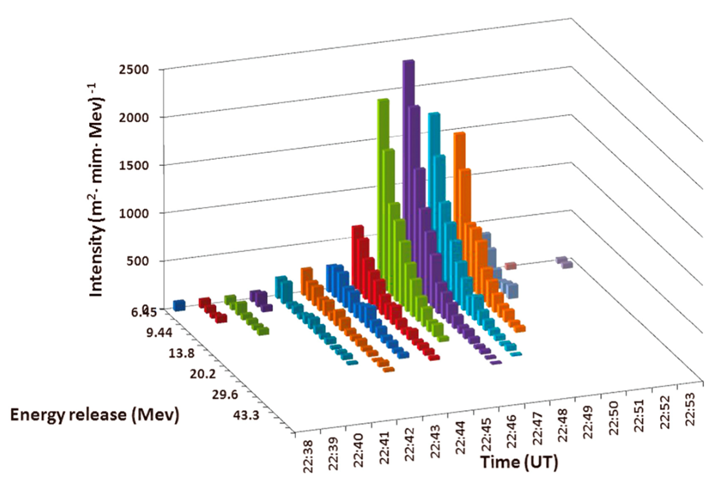
Figure 6. Differential energy
release histogram of the TGE gamma rays obtained in 60 cm. Thick scintillators
of the ASNT array.
The intensity of electron flux is ∼ 20 times less
comparing with gamma ray intensity. Because of very fast attenuation of
electrons in the atmosphere, gamma ray flux significantly exceeds the electron
flux; only for very low thunderclouds it is possible to detect electron flux.
The measured maximal energy release of TGE electrons in the 60 cm thick
scintillator was ∼25 MeV, for gamma rays maximal energy
release ∼35 MeV. Not the whole energy of particles is
released in the scintillator; highest energy particles can escape from the
scintillator sides. Thus, energy release is less or (in the best case) equal to
the energy of particle. TGE particles in order to be registered in the 60 cm
thick scintillator have to traverse significant amount of matter above the
detector, see Fig. 8. The electron energy losses in the matter above the
scintillator (∼10 g/cm2) are ∼20
MeV. Thus, we come to maximal electron energy above the roof ∼45
MeV in a good agreement with the model of the TGE initiation [8,9].
CHARGE STRUCTURE OF THE THUNDERCLOUD
The charge
structure of a thundercloud is depicted in Fig. 7. On the left side of the
cartoon, we present electron- gamma ray avalanches developed in the lower
dipole (TGE) and upper dipole of the thundercloud (so-called terrestrial gamma
flashes, TGFs,[10]). Red arrows denote 3 electric fields: downward directed
field in the upper dipole of the cloud formed by the main negative (MN) and
upper positive charge, the upward-directed field in the lower dipole formed by
MN and the LPCR, and upward-directed field formed by MN and its mirror (MIRR)
image in the ground. Throughout this
paper, we use the atmospheric electricity sign convention, according to which
the downward directed electric field or field change vector is considered to be
positive. Thus, the negative field measured by the EFM-100 electric field mill
corresponds to the dominant negative charge overhead (upward-directed electric
field).
The RREA is a threshold process, which occurred only
if the electric field exceeds the critical value in a region of the vertical
extent of about 1-2 km. The critical field value scales with the relative air
density n as ≈2.8 *n kV/cm, which is ≈1.7 kV/cm for the altitude of 5-6 km
a.s.l. typical for the center of the TGE-producing cloud above the Aragats
Station.
Following possible scenarios of electron acceleration in the atmospheric
electric fields can be considered:
1. The dipole formed by MN and
its mirror image at the ground (hereafter, MN-MIRR) that accelerates electrons
downward. If MN charge is very large inducing a very strong electric field that
exceeds the critical value, the RREA can be unleashed and TGE will be large,
and energies up to 50 MeV will be observed. The near-surface electric field is
deep negative reaching -25 ÷ 30 kV/m for the largest TGEs. Thus, regardless of
the cloud base location, the electric field extends almost down to the earth's
surface, and both gamma rays and electrons can be registered by particle
detectors and spectrometers.
2. When/if LPCR emerged,
additionally to the MN-MIRR, another dipole is formed by MN-LPCR. For few minutes, when LPCR is mature and
screens the detector site from the negative charge of MN, the near-surface
field is in the positive domain. TGE can be very intense in Spring when LPCR is
very close to the earth's surface (25-50 m, Chilingarian et al., 2019). Fields
induced by the MN-mirror and MN-LPCR are identically directed and their sum can
reach rather large values exceeding the threshold value to start RREA by
20-30%. In Summer, the distance to the cloud base is larger (200-400m) and
usually only gamma rays reach the earth's surface and are registered by the
particle detectors. Electrons are attenuated in the dense atmosphere. In
Autumn, again LPCR can be low and electric filed in the cloud very large
unleashing strong prolonged RREAs and, consequently, gigantic TGEs.In addition
to these basic scenarios, the fast-changing charge structure of the cloud
produces a more complicated configuration of the electric field. For instance,
TGE can start with mature LPCR, but after its contraction, only MN-MIRR
sustains a strong electric field. Alternatively, in the middle stage of the
first scenario, the LPCR is formed and for a few minutes, the near-surface
electric field rises and reaches positive values, and then returns again to
deep negative values when LPCR is depleted.
Lightning flashes reduce the negative charge above the earth's surface,
thus decreasing the electric field in the lower dipole below the RREA
threshold. RREA declines and high energy
particles are eliminated from the TGE flux. However, a smaller near-surface
electric field is still in place and 222Rn progeny continues to enhance the
"background" gamma ray flux, initiating long-lasting TGE [6,11]. TGE continues
also after the returning of the near-surface electric field strength to the
fair-weather value due to tens of minutes long life-time of 214Pb and 214Bi.
The rain brings back the Rn222 progeny from the atmosphere to the earth's
surface and for several tens of minutes provides additional gamma ray radiation
(the washout effect, [12]). Thus, the scenarios of the origination of the
downward electron-accelerating electric field are numerous and the
corresponding TGEs may vary in intensity and energy spectra; corresponding
near-surface electric field also can demonstrate several reversals.
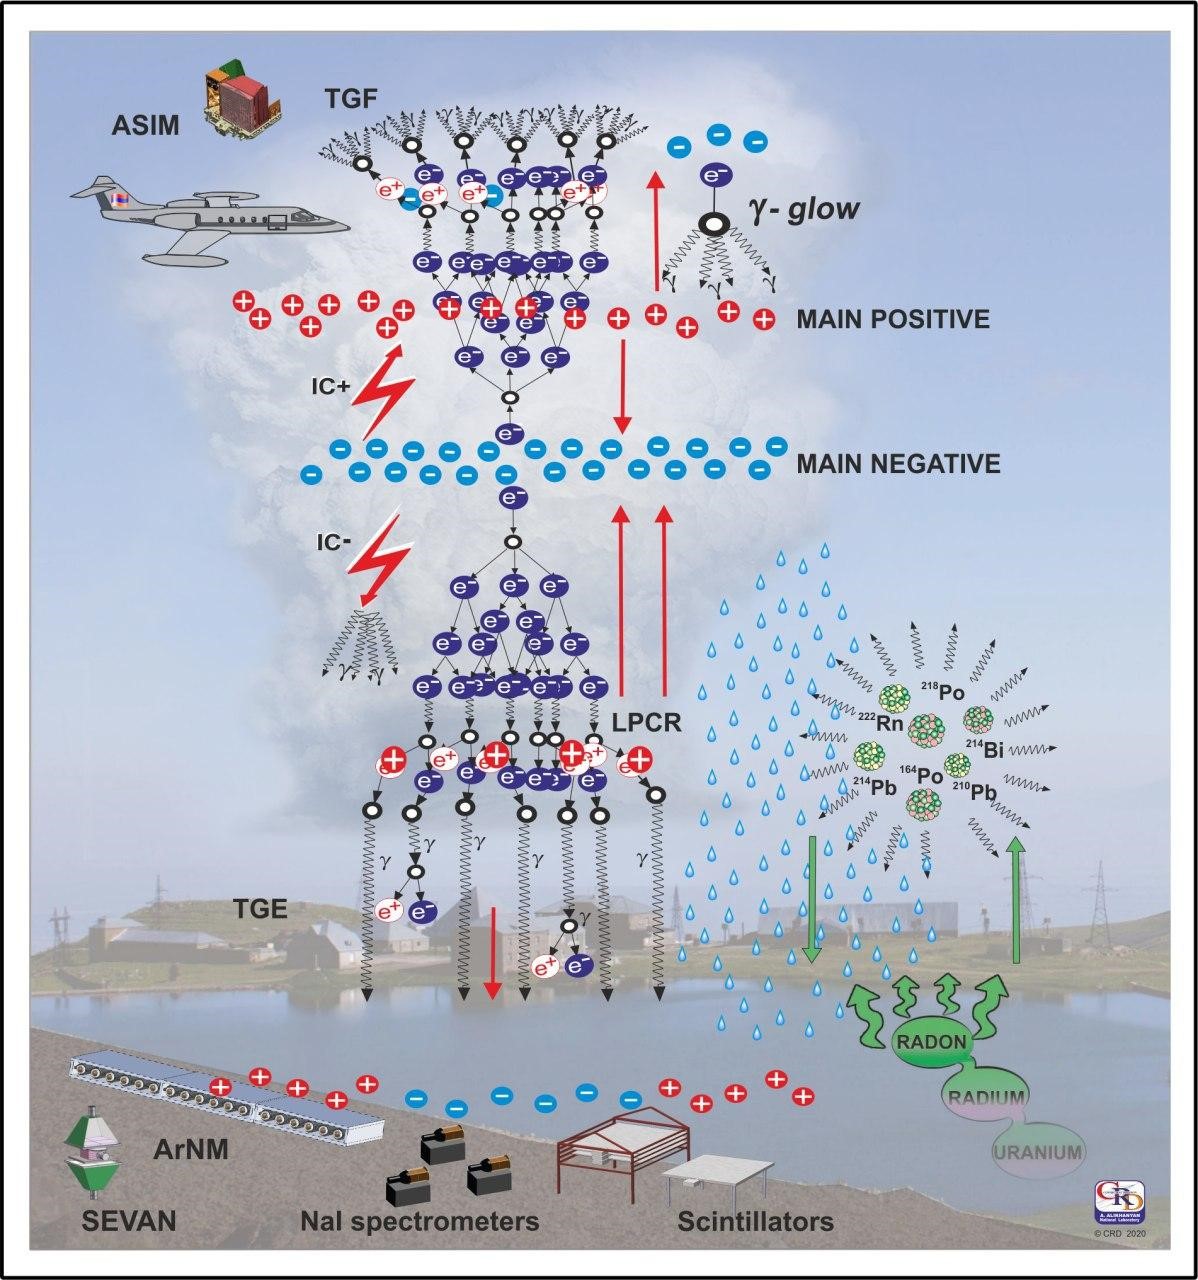
Figure 7. The electrical structure and particle fluxes related to
thunderstorm. Particle flux initiation in thundercloud (RREA) on the left side,
Rn222 progeny radiation on the right side.
In 2009-2020, the Aragats facilities registered more than 500 TGEs (see
the first and second catalogs of TGE events in[13,14]). Numerous particle
detectors and field meters are located in three experimental halls as well as
outdoors; the facilities are operated all year round providing continuous
registration of the time series of charged and neutral particle fluxes on
different time scales and energy thresholds. In this paper, we present precise
measurements of the electron and gamma ray energy spectra made by the large
scintillation spectrometer along with detailed simulations with CORSIKA code of
the RREA process in the electrified atmosphere. To confirm the electric field
structures obtained with modulated particle fluxes, additional evidence on the
density of the horizontal profile of the thundercloud obtained from the
numerical modeling of the state of the atmosphere was used. Weather Research
and Forecasting Model (WRF-model)
(https://www.mmm.ucar.edu/weather-research-and-forecasting-model) is widely
used in research applications, providing information on the structure and
dynamics of all types of convective systems with a horizontal resolution of
about 1 km, which is difficult to attain with other methods. Thus, we made an
initial step on the way to a detailed investigation of the structure of
TGE-producing clouds. We test if WRF model can confirm the "large-scale"
structure of the cloud obtained by the "screening" of the cloud with "beams" of
electrons and gamma rays.
ENERGY SPECTRA ANALYSIS OF RREA ELECTRONS AND GAMMA RAYS
Measurement of
the energy spectrum of RREA electrons and positrons is a rather difficult
problem. After exiting the region of a strong electric field where electrons
are accelerated and multiplied, the intensity of the electron beam rapidly
declines due to ionization losses. On the other hand, gamma rays are attenuated
much slower; thus, at the earth's surface, after propagation over few hundreds
of meters the intensity of gamma rays is 20-30 times larger than the intensity
of electrons (if any).
NaI
spectrometers, having a very small area (usually 0.01-0.03 m2) measure
usually only gamma ray flux, and, sometimes, where TGE is extremely intense
also a small fraction of electrons. Therefore, at present the only spectrometer
capable to register RREA electrons and recover their energy spectrum is the
ASNT detector located at Mt. Aragats [6]. The detector comprises a 4 m2 and
60 cm thick plastic scintillator (more than 100 times bigger than the largest
NaI crystal used in atmospheric high-energy physics measurements) and has the
capability to separate charged and neutral particles. From the ASNT detector,
we obtained a 2-second time-series of count rate and 20-second time series of
histograms of energy releases in a 60-cm thick plastic scintillator. TwoTGEs
observed in 2020 were selected for the analysis presented in this study. These
TGE events occurred in absolutely different conditions of the atmospheric
electric field, one was terminated by the lightning flash, the other declined
naturally at LPCR contraction. On 27 June 2020, a large storm lasting 2.5 hours
occurred on Aragats. Attempts to start TGE began at 19:01, 19:06, and 19:07;
all were terminated by lightning flashes shown by red arrows in Fig. 8a. TGE
started at 19:08 characterized by a long duration (≈20 minutes) with electric
field reversals, see Fig. 8a. We suppose that the TGE start at 19:08-19:11 was
controlled by the mature LPCR that produced a positive near-surface electric
field. The height of the cloud estimated from the outside temperature and the
dew point was 150 m.
After the
near-surface field polarity reversal from positive to negative at 19:11, the
atmospheric electric field was controlled by the main negative charge region
only, and during 7 minutes the field strength remained below -20 kV/m. During
this time interval, the particle flux continued to rise above the background
reaching 8.5 percent enhancement above the background. At 19:18 another
near-surface electric field polarity reversal from negative to positive
occurred and the near-surface electric field was controlled again by a newly
formed LPCR. As a result, the field strength remained ≈15 kV/m for 10 minutes.
All this time particle flux slowly decayed, staying constant for a few minutes,
and finally terminated at 19:31.
The structure
of the electric field of the storm that occurred on 25 September was much
simpler, see Fig. 8b. A large negatively charged region in the middle of the
cloud controls the atmospheric electric field and provides a much larger TGE
than the first event discussed above (20% enhancement above background) lasting
≈5 minutes until a negative cloud-to-ground (-CG) lightning flash abruptly
terminates it (distance to lightning flash was ≈5 km). The near-surface
electric field was in a deep negative domain (below - 20 kV/m) during TGE and
there were no signs in the near-surface time-series that an LPCR was formed.
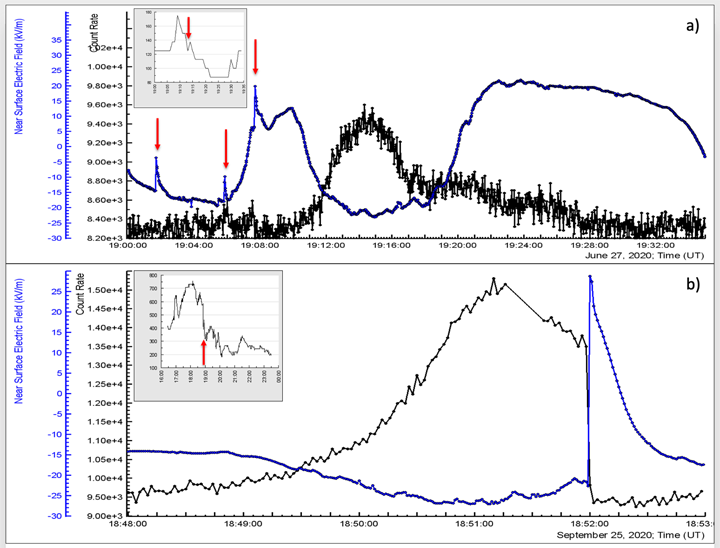
Figure 8. The time series of count rate measured by a 60-cm thick
scintillator (black) and disturbances of the near-surface electric field
(blue). By red arrows, lightning flashes that stopped attempts to TGE start and
the approximate height of the cloud base during TGE (in the insets) are shown.
In Fig. 9 a and
b we present differential energy spectra of these two TGE events for the minute
of the highest flux. Three 20 sec. histograms were joint to form a 1-minute
histogram of the energy releases in a 60 cm thick scintillator for the further
recovering of the energy spectra using the response function of spectrometer
obtained with GEANT 4 simulation.
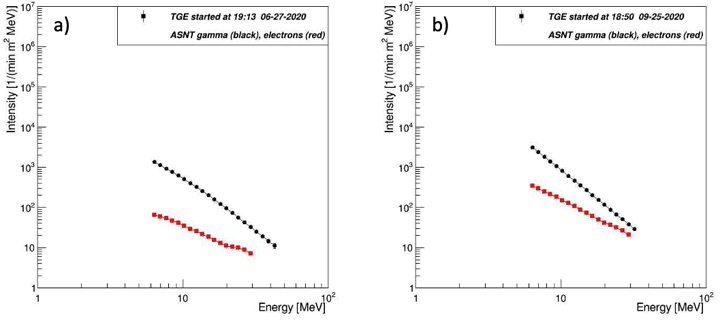
Figure 9. Differential energy spectra of RREA electrons (red) and gamma
rays (black) measured by ASNT spectrometer at altitude 3200 m at highest
particle flux above 7 MeV.
CORSIKA
SIMULATIONS OF THE RREA PROCESS ABOVE ARAGATS STATION
To
understand the avalanche development in the electrified atmosphere and to
compare measured energy spectra with simulated ones we used the CORSIKA
[15]version 7.7400, which takes into account the effect of the electric field
on the transport of particles[16]. As it was already demonstrated by CORSIKA
and GEANT4 simulations [17] RREA process is a threshold process and avalanches
can be started when the atmospheric electric field exceeds the threshold value
that depends on the air density. The extent of the electric field also should
be sufficiently large to ensure avalanche development. The simulation of the
RREA was done within the vertical region of the uniform electric field with
strengths exceeding the runaway breakdown threshold by a few tens of percent on
1-3 km height above Aragats station. Since critical energy smoothly decreases
with the increase of air density, the assumed uniformity of the electric field
leads to the change of the surplus to the critical energy at different heights
corresponding to the air densities. We do not test electrical fields stronger
than 2.2 kV/m and weaker than 1.8 kV/cm. The energy spectrum of seed electrons
was adopted from the EXPACS WEB calculator [18] following the power low with
index 1.173 in the energy range 1-300 MeV. The development of RREA will
certainly increase the electrical conductivity in the cloud. In numerous
studies [19,20] was shown that lightning flash occurs after the RREA
initialization threshold exceeds 10-40%. The RREA simulation codes do not
include the lightning initialization mechanism, thus one can exceed the
strength of the electric field above any reliable value to get billions and
billions of avalanche particles, but it is not physically justified. Therefore,
starting from the relatively weak strengths of the electric field we enhance it
step-by-step to reach the electron and gamma ray number measured in the
experiment. The largest TGEs occurred when the distance to the cloud base was
25 - 100 m (see Fig 17 in [21]), thus in our simulations, the electromagnetic
avalanche continued propagation in the dense air additionally 25, 50, 100, and
200 meters before registration. Simulation trials include from 103
to 104 events for the electric field strengths of 1.8-2.2 kV/cm. The
propagation of electrons and gamma rays were followed in the avalanche until
their energy decreased down to 0.05 MeV. In simulation trials, we follow the
development of the RREA where we show the number of electrons and gamma rays in
RREA per seed electron on different stages of avalanche development in the
strong electric field and after leaving the strong electric field region, see
Fig. 10a and b. From Fig. 10, we can see that within electric field the number
of electrons exceeds the number of gamma rays, however, after the exit from the
electric field electron flux rapidly attenuates (see Fig. 10a) and, at
distances >100 m below the strong electric field, the number of gamma rays
largely exceeds the number of electrons. For the lower electric field strengths
(1.8 and 1.9 kV/cm) the RREA process attenuates before reaching the observation
level at 3200 m (see green and brown curves in Fig. 10a), as the critical value
is ≈2.0 kV/cm at this altitude.
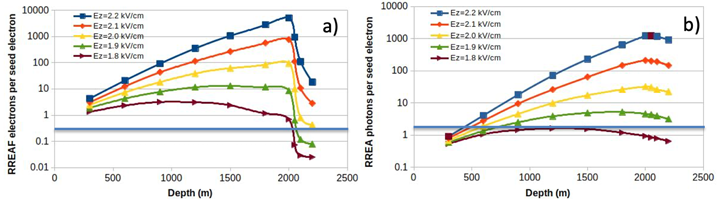
Figure 10. Development of the electromagnetic avalanche in the
atmosphere. Avalanche started at 5400 m a.s.l. (0 depth), that is 2200 m above
the Aragats station. The number of avalanche particles is calculated each 300
m. After exiting from the electric field propagation of avalanche particles is
followed additionally 200 m before reaching the station. By blue line, we show
the electron and gamma ray number per seed electron for the TGE that occurred
on 25 September 2020.
In Table 1 we
show the parameter of 2 TGEs registered in 2020 and similar parameters of
CORSIKA simulations of the RREA process in the atmosphere. In the second
column, we show the number of electrons and gamma rays in RREA simulation per
seed electron on different distances from the exit of the strong electric field
and the number of electrons and gamma rays per seed electron. Thus, we can
directly compare measurement and simulation results. In the third column, we
show the height of the cloud assumed in simulation and estimated in the
experiment. In the fourth column, we show the electron-to-gamma ratio for
particles with energies above 4 MeV for simulation and experiment. The number
of seed electrons for was obtained from the EXPACS particle flux calculator on
5400 m is 42,000 per minute per m2.
As we can see
in the Fig. 10 and in Table 1, the energy spectra of the observed 27 June and
25 September satisfactory match Monte Carlo calculations of the RREA developing
in the 2 km extended electric field of 1.8-1.9 kV/cm strength, which ends ≈100
m above earth's surface.
Table 1. Parameters of the RREAs calculated with CORSIKA code and of 2
TGES observed in 2020.
| N of el. E> 4 MeV per seed electron | N of g rays E> 4 MeV per seed electron | Height of the cloud base | Ne/Ng >4 MeV | |
| 1.8 kV/cm | 0.073 | 0.83 | 50 | 0.088 |
| 1.8 kV/cm | 0.03 | 0.78 | 100 | 0.037 |
| 1.9 kV/cm | 0.012 | 3.9 | 100 | 0.017 |
| 09.25.2020 | 0.1 | 0.62 | 300 | 0.03 |
| 06.27.2020 | 0.03 | 0.36 | 100 | 0.083 |
MAXIMUM
STRENGTH OF THE ATMOSPHERIC ELECTRIC FIELD
Understanding
the maximum potential difference (voltage) inside thunderstorms is one of the
fundamental problems of atmospheric physics directly connected with the enigma
of the lightning initiation and electron acceleration. The history of the
problem is described in [1] and references therein. Joe Dwyer derived in his famous paper a
fundamental limit on the maximum electric field that a thundercloud can sustain
[2]. When the electric field in the cloud is significantly higher than the
threshold field to initiate an electromagnetic avalanche on runaway electrons
(runaway breakdown, or relativistic runaway electron avalanche RB/RREA, [3]),
the electron flux made enough ionization to initiate a lightning flash.
Numerous measurements on balloons, aircraft, and on mountain heights confirm
that usually particle fluxes are abruptly terminated by a lightning flash. More
than 100 thunderstorm ground enhancements (TGEs) observed on Aragats were
terminated by the lightning flash when the magnitude (absolute value) of the
near-surface electric field (a proxy of the intracloud electric field0 was
sufficiently high [4,5]. Thus, the energy spectra of TGE electrons and gamma
rays measured at the flux maximum just before lightning, contain information on
the strength of the electric field that initiates TGE and then stops it to
initiate a lightning flash. We perform the simulation of the RREA process in
the atmosphere to test conditions leading to maximum attainable electric fields
that are directly connected with maximum particle fluxes and maximum energies
of particles in RREA. However, the RREA simulation codes do not include the
lightning initiation mechanism; thus, one can exceed the strength of the
electric field above any real value to get billions and billions of avalanche
particles, but it is not physically justified. It is why, in our comment [6] on
the estimate of the atmospheric electric potential of 1.3 GV reported in [7],
we mentioned that potential within a gap of 2 km at 8-10 km altitude above sea
level was highly overestimated. Any physical inference based only on data from
one detector and on only one particular species of cosmic rays and neglecting
corresponding atmospheric phenomena is highly risky.
Direct
monitoring of the intracloud electric field with any spaceborne or ground-based
technologies is not feasible yet, hence, we suggest using the monitoring of
particle fluxes modulated by the electric field to estimate the attainable
value of the potential drop. Measurements of the modulation of cosmic ray flux traversing
the electrified cloud provide a new type of evidence on cloud electrification
and, possibly, allows us to obtain a tighter estimate of the maximum potential
difference in thunderclouds. The big advantage of our approach is the
multi-year 7/24 monitoring of different species of cosmic rays available from
the measurements at the high-mountain research stations. In contrast,
accidental balloon flights cannot provide continuous observations of a
thunderous atmosphere and can miss extremely large voltages. TGEs observed on
mountain peaks during strong thunderstorms comprise millions of particles
(electrons, gamma rays, and neutrons), enhancing the intensity of background
flux of cosmic rays up to a hundred times [8]. The same field that accelerates
electrons downward in the direction of the earth will reduce the flux of muons,
due to the excess of positive over negative muon flux. Simultaneous monitoring
of these species of secondary cosmic rays with SEVAN East-European network of
particle detectors [9] gives a possibility to select from the multiyear
observations on Aragats in Armenia, Musala in Bulgaria, and Lomnicky Stit in
Slovakia most violent TGEs corresponding to extreme values of the electric
field. Recently we published the analysis of the 13-year largest TGE observed
on Aragats on 4 October 2010 and estimated the upper boundary of maximum
potential difference to be 350 MV [10]. In the present paper, analyzing the
world's largest TGEs registered in Slovakia (observed at mountain top Lomnicky
Stit on 20 June 2017[11]) and using CORSIKA [12] simulation of the RREA process
in the strong electric field we show that voltage can reach 500 MV.
TGE
MEASUREMENTS WITH EAST-EUROPEAN SEVAN NETWORK
A
network of particle detectors known as SEVAN (Space Environment Viewing and
Analysis Network, was developed in the framework of the International
Heliophysical Year (IHY-2007) and now operates and continues to expand within
the International Space Weather Initiative (ISWI). The SEVAN network is
designed to measure fluxes of neutrons and gamma rays, of low-energy charged
particles, and high-energy muons. The rich information obtained from the SEVAN
detector allows us to estimate the solar modulation effects posed on different
species of Galactic cosmic rays and fluxes of charged and neutral particles
during solar energetic proton events (SEP). SEVAN modules located on mountain
tops are actively used in the research in the newly emerging field of
high-energy physics in the atmosphere. Thus, with the one and the same detector,
we can investigate both the solar-terrestrial relations and atmospheric
high-energy physics. Observational data from SEVAN particle detectors located
on mountain tops Musala (Altitude - 2925 m, Latitude - 42º11', Longitude -
23º35' in Bulgaria, and Lomnicky Stit (Altitude - 2634 m, Latitude - 49º12',
Longitude - 20º12') in Slovakia reveal extreme TGE events. They comprise
enormous enhancement of the electron and gamma ray fluxes and simultaneous
decrease of muon flux. In Fig.11 we show the chart of the SEVAN detector. The
detector is assembled from standard slabs of plastic scintillators of 50x50x5
cm3 size. Thick 50 x 50 x 20 cm3 scintillator assembly (5
stacked slabs) and two 100 x 100 x 5 cm3 lead filters are located
between 2 identical assemblies of 100 x 100 x 5 cm3 scintillators (4
slabs). The data stream from the SEVAN comprises 1-minute count rates (or 1-sec
count rates) from 3 scintillator layers. All combinations of signals from
detector layers are stored as well: "100" combination means that the signal was
only in the upper layer (low energy particles); "111" - that signal comes from
all 3 layers (high-energy muons), "011" - near-horizontal muons). The "010"
combination selects mostly neutral particles - gamma rays and neutrons.
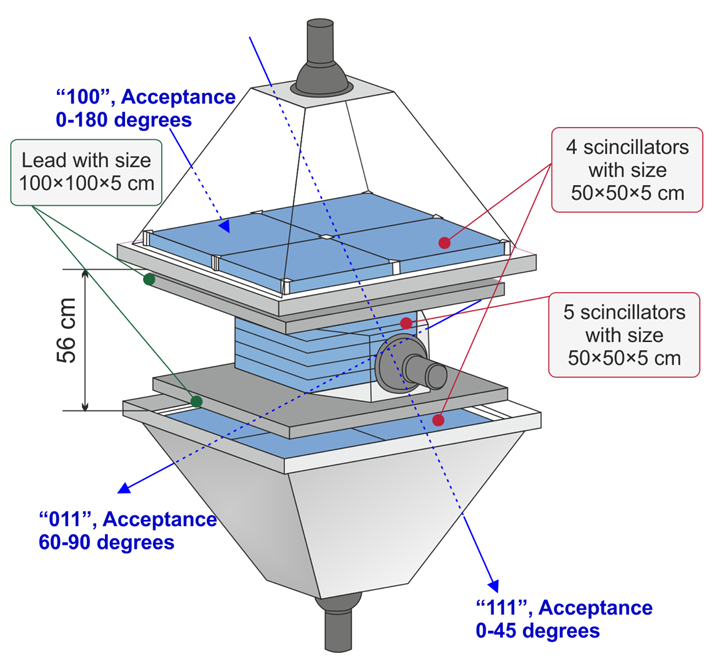
Figure 11. The module of the European "Space Environmental Viewing and
Analysis Network" (SEVAN).
The purity of
particle selection by SEVAN coincidences was estimated by simulations, see Fig.
4 in [22]. The purity of muon selection is rather high ~95%, due to a 10 cm
thick lead filter between first and third scintillators. The energy threshold
of the upper detector is ~ 7 MeV. The minimum energy of muons ("111"
combination) is ~250 MeV. The efficiency
to register charged particles by the upper scintillator is ≈95%, and gamma rays
- ≈6%.
The atmospheric
electric field, which is especially large during violent thunderstorms
accelerates and decelerates charged particles, depending on the field direction
and particle charge. The extreme TGEs occurred when the electric field
accelerates electrons in the direction to the earth's surface result in an
enormous burst of the counts of the upper scintillator and "100" combination of
SEVAN detector, sometimes enhancing the fair-weather count rate a hundred
times! Simultaneously, the same field that accelerates electrons downward
causes muon flux depletion ("111" combination) due to the excess of positively
charged muons upon negative ones (the "muon stopping effect", see for
discussion and references [23]). Another evidence of the large electric field
in the thundercloud is the large depletion of the inclined trajectories, "011"
combination; inclined high-energy muons traversing more distance in the
electric field than vertical ones. The TGE particle, due to the vertical
orientation of the atmospheric electric field arrives in the near-vertical
direction; from the near-horizontal direction can arrive only high-energy
muons, that can traverse large distances in the atmosphere without absorption.
Described above modulation effects registered by SEVAN detectors in Slovakia
and Bulgaria are shown in Figs. 12 and 13.
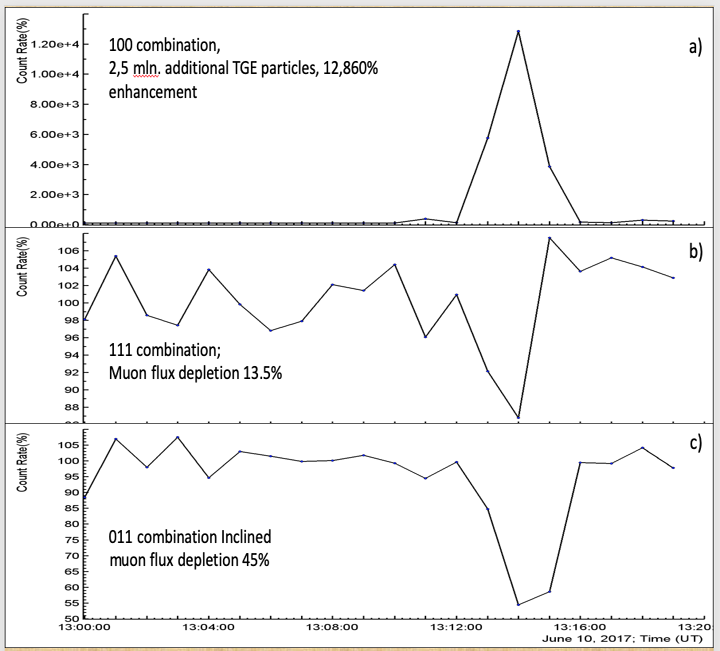
Figure 12. Extreme TGE event detected by SEVAN detector located on
Lomnicky Stit mountain: a) - TGE particles - electrons and gamma rays; b) high
energy muons; c) inclined muons.
The extreme event was recorded in Slovakia on 10 June 2017 [24]; the enhancement of the count rate of the "100" combination at the minute 13:12-13:13 was enormous and reached 12,860% (Fig 12a) of the fair-weather value. This world's ever-largest TGE reaches its maximum in one minute. The enormous runaway electron flux initiates a lightning flash that stops TGE. TGE was terminated by complicated multiple stroke discharge registered by the EUCLID network at 13:14:35 [25]; 5 strokes from 7 occurred within 1 km distance from the detector.
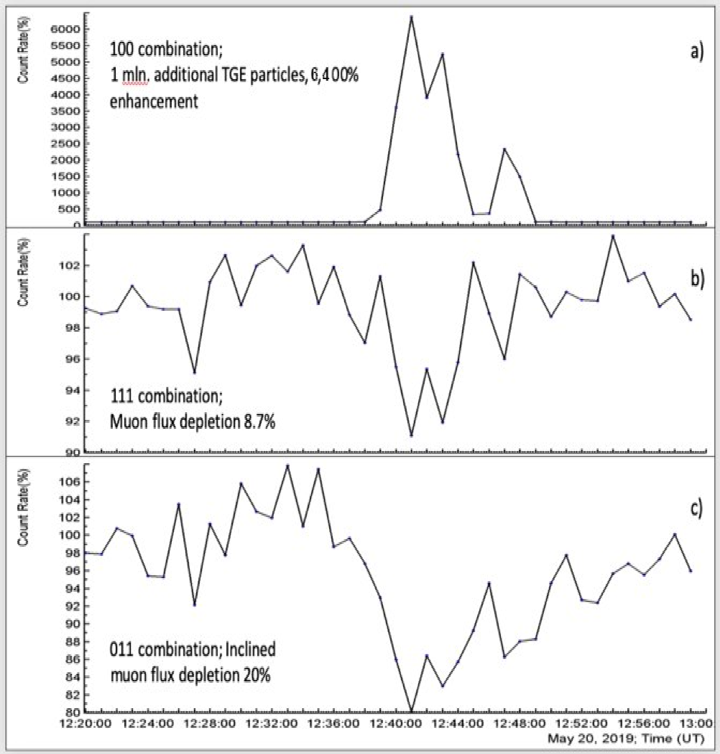
Figure 13. Very Large TGE event detected by SEVAN detector located on
Musala mountain: a) - TGE particles - electrons and gamma rays; b) high energy
muons; c) inclined muons.
The muon flux depletion at the same minute was 13.5%, (see Fig. 12b), it was twice larger than for the strongest event ever observed in Aragats on 4 October 2010 [26]. The depletion of inclined muons was much larger 45%, see fig. 12c. As we can see in Figs 12 and 13 the maximum enhancement of TGE particles coincides with the minimum of the muon flux. A very large TGE event was recorded in Bulgaria on 20 May 2019 [27]. The shape of the event was more complicated demonstrating 3 peaks in 10 minutes (due to 3 terminations of TGE by the lightning flashes at 12:42:18, 12:46:13, and 12:50:07). The increase of the count rate of the "100" combination during one minute, at 12:41-12:42 reaches 6,400% (see Fig. 13a) of the fair-weather value. The muon flux depletion at the same minute was 8.7%, Fig 13b. The depletion of inclined muons was 20%, see fig. 13c. In Table 2 for convenience, we show both the mean of 1-minute and 1-second count rates measured just before the extremely large event at Lomnicky Stit and count rates measured at the maximum flux. As we can see from the Table 2, the count rates of the upper SEVAN scintillator and combination "100" (signal only in the upper scintillator) highly exceed fair-weather count rates, the enhancement is more than 100 times (N) (last column of Table 2). The enhancement of SEVAN 010 and Neutron Monitor (NM) counts do not reach these extreme values but are also much larger than measured on Aragats. Importantly, the large count enhancement was observed for combination "010" and NM, which indicates the registration of energetic gamma-rays and neutrons [28]. A tremendous enhancement of neutron flux (140%) was measured by the neutron monitor at the same location and at the same time. Neutron monitor evidence is very important as an independent observation and as a prove of photonuclear reactions of high energy gamma rays born in the TGE (the previous highest flux detected by neutron monitor on Aragats was only 5.5% [4].
Table 2. Mean values of the count rates of particle
detectors located at Lomnicky Stit and extreme values at maximum flux minute
registered on June 10 2017
|
Name
|
Mean 1/min | σ | Mean 1/sec | 13:14 1/sec | 13:14 1/min | % | N |
| Upper | 25047 | 171 | 417 | 42233 | 2,534000 | 10,013 | 101 |
| Coincidence 111 muons | 1929 | 48 | 32.2 | 27.8 | 1666 | 87 | |
| Coincidence 100 | 19550 | 142 | 326 | 42,100 | 2,526000 | 12,890 | 130 |
| Coincidence 010 | 1468 | 39 | 24.5 | 55.5 | 3326 | 25 | 2.7 |
| Neutron monitor | 29640 | 265 | 494 | 1187 | 71220 | 140 | 20 |
As usual, along with the enhancement of the electromagnetic component of
the TGE, we register depletion of muon flux due to muon stopping effect ("111"
combination, [23]).
Measured high-energy gamma ray and neutron fluxes (combination "010") were
also the largest ever measured by the particle detectors located on the earth's
surface. In Fig. 14 we compare the largest enhancements obtained in 010
combination of SEVAN at 3 mountains. The enhancement observed at Lomnicky Stit (≈125%) is much larger than at Musala
and Aragats (both ≈15%). SEVAN's "010" combination measure neutrons and gamma rays. It is very
difficult to separate fluxes because the SEVAN detector's "010" combination
counts are due to gamma rays and neutrons; the neutron monitor also is
sensitive to gamma rays, see discussion in [28]. To disentangle neutron and
gamma ray fluxes we need to measure the energy spectra of TGE gamma rays.
Unfortunately, gamma ray spectrometers weren't installed on Lomnicky Stit
yet.
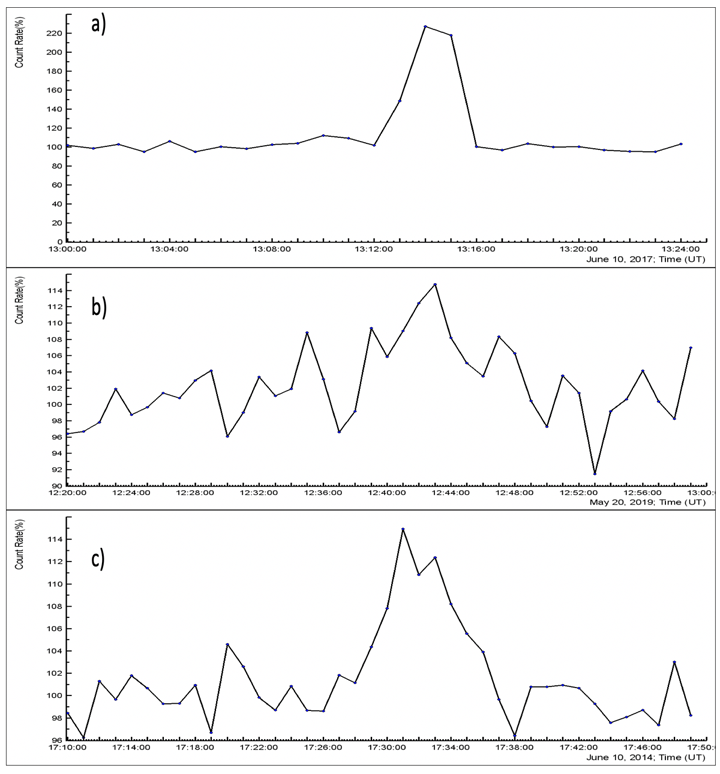
Figure 14. Extreme TGE events detected by SEVAN 010
combination detector located on Lomnicky Stit (a), Musala (b) and Aragats
(c).
ESTIMATION OF THE MAXIMUM ATMOSPHERIC ELECTRIC FIELD AT LOMNICKY STIT
By measuring the maximum enhancement of particle flux at Lomnicky Stit, we
estimate the atmospheric electric field that can enable such a huge RREAs,
which reaches the earth's surface and generates such an enormous TGE. We
recognize, that the relation
between electric field strength and TGE particle fluxes is nonlinear and
depends on many unknown parameters of atmospheric electric field and
meteorological conditions (structure of charged layers, the height of the
cloud, wind speed, etc.). However, extremely large particle fluxes measured by
the SEVAN detector allow us, as we hope, to obtain a reasonable estimate of the
maximum electric field choosing the appropriate field strength and its spatial
extent from a number of alternatives obtained in the simulation trials. CORSIKA
version 7.7400 [15,16], which takes into account the effect of the electric
field on the transport of particles was used in simulations. As it was already
demonstrated in our previous simulations with CORSIKA and GEANT4 codes [29],
the multiplication and acceleration of seed electrons, namely the RREA process
[1] is a threshold process and avalanches started when the atmospheric electric
field reaches the critical value that depends on the air density. The extent of
the electric field also should be sufficiently large to ensure avalanche development.
The simulation of the RREA was done within the 2.6-4.6 km heights where the
uniform electric field was introduced with strength exceeding the runaway
breakdown threshold by 10-40%. Uniformity of the electric field extending 2 km
leads to the change of the surplus to critical energies at different heights
according to particular air density value. Thus, the 2.4 kV at 4.6 km height is
≈32% larger than critical energy, and at 2.6 km height is only ≈15% larger. At
the exit from the electric field, the electromagnetic avalanche continued
propagation over 400 m in the dense air above the detector before registration.
To avoid
contamination of high-energy gamma rays generated by the MOS process
(modification of electron energy spectra, see details in [8]) simulations were
performed with vertical beams of 1 MeV electrons (seed particles for the RREA).
The MOS process generates high-energy bremsstrahlung gamma rays from high
energy electrons of the ambient population of cosmic rays which, can
artificially enlarge the maximal energy achievable in the RREA. Simulation
trials include 10000 events for the electric field strengths 1.8-2.3 kV/cm and
1000 for the strengths - 2.4 and 2.5 kV/cm. Electrons and gamma rays were
followed in the avalanche until their energy decreased down to 0.05 MeV. The
energy spectra of RREA electrons and gamma rays were obtained as a result of
each simulation trial, as well as the number of electrons and gamma rays
(normalized to one seed electron) calculated every 300 m in the electric field,
and at distances 50,100. 200 and 400 m after exit from it, see Fig.15 a) and
b). In Figs. 15,16 and Table 3 the number of electrons and gamma rays was
integrated from 7 MeV to be compared with SEVAN upper scintillator count rate
(energy threshold ≈7 MeV). We can see from the figures that for large electric
field strengths the number of electrons exceeds the number of gamma rays,
however, after the exit from the electric field electron flux rapidly
attenuates (see Fig. 15b) and, at 100 m below the electric field number of
gamma rays exceeds the number of electrons by an order of magnitude.
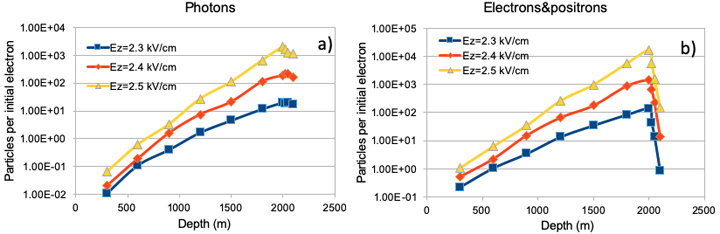
Figure 15. Development of the electromagnetic avalanche in the
atmosphere. Avalanch18started at 4600 m, 2 km above the SEVAN detector. The
number of avalanche particles is calculated each 300 m. After exiting from
electric field avalanche is followed additionally 100 m.
To estimate the number of expected counts of SEVAN detector for different electric field configurations we need to know the number of seed electrons entering the electric field region. Using the well-known energy spectrum of the secondary cosmic ray electrons (obtained from the WEB calculator EXPACS [18]), we integrate the number of cosmic ray electrons at the height of 4600 m from 1 to 300 MeV and obtain 455/m2 sec. Proceeding from this number and taking into account the efficiencies of particle registration in the upper scintillator of the SEVAN detector (≈95% for electrons and ≈6% for gamma rays) we obtain the expected number of counts for the different configurations of the electric field. We show in the first 3 columns of Table 3 the number of particles per one seed electron to be registered by the upper SEVAN scintillator and in the last column - for all 455 seed electrons incident on 1 m2 per second on the height of 4600m. In the last row of Table 3, we show the number of TGE particles measured by the upper scintillator of SEVAN at 13:14 UTC.
To estimate the number of expected counts of SEVAN detector for different electric field configurations we need to know the number of seed electrons entering the electric field region. Using the well-known energy spectrum of the secondary cosmic ray electrons (obtained from the WEB calculator EXPACS [18]), we integrate the number of cosmic ray electrons at the height of 4600 m from 1 to 300 MeV and obtain 455/m2 sec. Proceeding from this number and taking into account the efficiencies of particle registration in the upper scintillator of the SEVAN detector (≈95% for electrons and ≈6% for gamma rays) we obtain the expected number of counts for the different configurations of the electric field. We show in the first 3 columns of Table 3 the number of particles per one seed electron to be registered by the upper SEVAN scintillator and in the last column - for all 455 seed electrons incident on 1 m2 per second on the height of 4600m. In the last row of Table 3, we show the number of TGE particles measured by the upper scintillator of SEVAN at 13:14 UTC.
Table 3. The simulated count rates
in the upper scintillator of the SEVAN detector for different configurations of
the atmospheric electric field.
| Electron Counts /m2 sec | Gamma ray Counts /m2 sec | Sum el. + gamma /m2 sec | Total expected counts (x 455) | |
| 2.4kV/cm 50 m | 175 | 13 | 188 | 85540 |
| 2.4kV/cm 100 m | 11 | 10 | 21 | 9555 |
| 2.5kV/cm 50 m | 1268 | 76 | 1344 | 611520 |
| 2.5kV/cm 100 m | 119 | 68 | 187 | 85085 |
| SEVAN L.S. 10.6.2017 upper | 42223 |
The count rate of the upper
detector of SEVAN was 42,223 (see Table 2); from simulations, we estimate the
expected count rate ≈ 85,000 for 2.4 kV/cm if the electric field terminated at
50 m above the earth's surface, and, for 2.5 kV/cm if electric field terminated
at 100 m above the earth's surface. We cannot establish one-to-one relation
between electric field strength and expected count rate because of the
uncertainty in the extent of the electric field accelerated electrons downward.
Nonetheless, the information from Fig. 15 and Table 3 allows us to limit the
maximum electric field by 2.5 kV/m (a conservative estimate assuming
termination of electric field on the height of 100 m above the earth's
surface). The number of electrons increases very fast when the electric field
strength is increasing above 2.4 kV/cm and, the lightning flash will inevitably
stop further multiplication of electrons in the RREA avalanches. It is well
known that RREAs might limit thunderstorm electric fields [19]. In [20], 10
electric field soundings were selected (from sensors located at balloons) near
lightning initiation locations. For all cases, the electric field exceeds the
runaway breakdown threshold by factors of 1.1 - 3.3 in the few seconds before
the flash. The RREA above Lomnicky Stit also was terminated by the lightning
flash, as well as numerous large TGEs observed at Aragats [30]. Sure, we made many simplifications in
simulation trials and we are yet very far from expecting exact numerical
coincidences. However, the huge enhancement of obtained count rate with the
increase of the electric field value from 2.4 to 2.5 kV/cm, allows us to
conclude that for the world's largest TGE measured at Lomnicky Stit the
electric field does not reach 2.5 kV/cm and, consequently, the potential
difference in the atmosphere is not larger than 500 MV. Numerous other
simulations with lower strengths of electric field produce 10-100-times fewer
particles reaching the SEVAN detector (see Fig.15).
In Fig. 16 we
show another characteristic of the RREA energy spectra, namely, - the maximum
energy of particles reached in the RREA development. This parameter does not
depend on the absolute calibration of the seed particle spectrum.
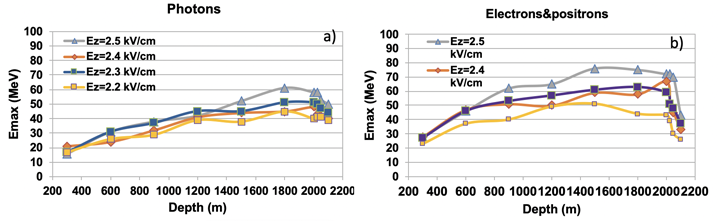
Figure 16. Maximum energies of RREA electrons and gamma rays. Avalanche
started at 4600 m, 2 km above the SEVAN detector. The maximum energies of
avalanche particles are calculated each 300 m. After exiting from electric
field avalanche is followed additionally 400 m. Simulations were performed with
a fixed energy of seed particles (1 MeV) to avoid large gamma ray energies due
to MOS and not the RREA process.
In Picture 6 we can see that maximum energies of electrons and gamma rays at Lomnicky Stit obtained from simulations are ≈ 30% larger than ones measured at Aragats for the largest TGEs (see Figs. 7 and 11 in [23]). Unfortunately, at Lomnicky Stit there were no particle spectrometers for direct comparison with experimental spectra. The enhancement of the count rate of the upper scintillator of the SEVAN detector at Aragats never exceeds 2 times the fair-weather count rate and the maximum energy of particles in the RREA cascade was ≈50 MeV. The corresponding enhancement of SEVAN located in Slovakia exceeds the fair-weather count rate 100 times. Consequently, the maximum energy of the RREA particles can reach 80 MeV (see Fig 15b) for the observed ever largest TGE event.
REFERENCES:
[1] A.V. Gurevich, G.M. Milikh, R.
Roussel-Dupre, Runaway electron mechanism of air breakdown and preconditioning
during a thunderstorm, Phys. Lett. A 165 (5-6) 463-468(1992).
[2] J.R. Dwyer, The relativistic feedback
discharge model of terrestrial gamma ray flashes, J. Geophys. Res. 117 (2012)
A02308.
[3] J.R. Dwyer, M.A. Uman, The physics of
lightning, Phys. Rep. 534 (4) (2013) 147-241.
[4] A. Chilingarian, A. Daryan, K.
Arakelyan, A. Hovhannisyan, B. Mailyan, L. Melkumyan, G. Hovsepyan, S.
Chilingaryan, A. Reymers, L. Vanyan, Ground- based observations of
thunderstorm-correlated fluxes of high-energy electrons, gamma rays, and
neutrons, Phys. Rev. D 82 (4) (2010) 043009.
[5] Suszcynsky,
D.M., Roussel‐Dupre,
R., Shaw, G., 1996. Ground‐based
search for X‐rays
generated by thunderstorms and lightning. J. Geophys. Res. 101, 23,505-23,516, http://dx.doi.org/10.1029/96JD02134.
[6]
A. Chilingarian and G. Hovsepyan, and B. Mailyan, In situ measurements of the
runaway breakdown (RB) on Aragats Mountain, Nucl. Instrum. Methods Phys. Res.,
Sect. A 874, 19 (2017).
[7]
A.V. Gurevich, K.P. Zybin, R.A. Roussel-Dupre, Lightning initiation
by simultaneous of runaway breakdown and cosmic ray showers, Phys. Lett. A 254 (1999)
79.
[8] A.Chilingarian,B.Mailyan,L.Vanyan,Recovering
of the energy spectra of electrons and gamma rays coming from the
thunderclouds, Atmos. Res. 114-115
(2012) 1.
[9] A. Chilingarian, Thunderstorm ground
enhancements -model and relation to light- ning flashes, J. Atmos. Sol.-Terr.
Phys. 107 (2014) 68-76.
[10]
Fishman, G.J., Bhat, P.N., Mallozzi, R., Horack, J.M., Koshut, T., Kouveliotou,
C., Pendleton, G.N., Meegan, C.A., Wilson, R.B., Paciesas, W.S., Goodman, S.J.,
Christian, H.J., 1994. Discovery of intense gamma ray flashes of atmospheric
origin. Science 264 (5163), 1313-1316.
[11]
Chilingarian, Hovsepyan G., Soghomonyan S., et al., Structures of the
intracloud electric field supporting origin of long-lasting thunderstorm ground
enhancements, Physical review 98, 082001(2018).
[12]
Chilingarian, A., Hovsepyan, G. & Sargsyan, B. Circulation of Radon progeny
in the terrestrial atmosphere during thunderstorms. Geophysical Research
Letters,
47, e2020GL091155(2020a) https://doi. org/10.1029/2020GL091155.
47, e2020GL091155(2020a) https://doi. org/10.1029/2020GL091155.
[13] Chilingarian A., Karapetan T., Melkumyan L.,
Statistical analysis of the Thunderstorm Ground Enhancements (TGEs) detected on
Mt. Aragats. J. Adv. Space Res., 52, 1178
(2013).
[14]
A. Chilingarian, H. Mkrtchyan, G. Karapetyan, B. Sargsyan, and A. Arestakesyan,
Catalog of 2017 thunder- storm ground enhancement (TGE) events observed on
Aragats, Sci. Rep. 9, 6253 (2019).
[15]
D. Heck, J. Knapp, J. N. Capdevielle, G. Schatz, and T. Thouw, Report No. FZKA
6019, 1998, Forschungszentrum, Karlsruhe, https://www.ikp.kit.edu/corsika/70.php.
[16] S.Buitink, H. Falcke, et al. Monte Carlo simulations of air showers
in atmospheric electric fields, Astropart. Phys. 33 (2010) 1.
[17]
Chilingarian A., Zazyan M., Karapetyan G., Modelling of the electron
acceleration and multiplication in the electric fields emerging in terrestrial
atmosphere, Proceeding of 8th TEPA symposium, 2018, Nor-Amberd,
"Tigran Mets", Yerevan, (2018b).
[18]
T. Sato, Analytical Model for
Estimating the Zenith Angle Dependence of Terrestrial Cosmic Ray Fluxes, PLOS ONE,
11(8): e0160390, (2018), http://phits.jaea.go.jp/expacs/
[19]
Marshall, T. C., M. P. McCarthy, and W. D. Rust (1995a), Electric field
magnitudes and lightning initiation in thunderstorms, J. Geophys. Res., 100,
7097.
[20] M. Stolzenburg, T. C. Marshall, W. D.
Rust, E. Bruning, D. R. MacGorman, and T. Hamlin (2007), Electric field values
observed near lightning flash initiations, Geophys. Res. Lett., 34, L04804.
[21] A.
Chilingarian, G. Hovsepyan, T. Karapetyan, et al., Structure of thunderstorm
ground enhancements, PRD 101, 122004 (2020).
[22]
A.Chilingarian, V. Babayan, T. Karapetyan, et al., The SEVAN Worldwide network
of particle detectors: 10 years of operation, Adv. Space Res. 61 (2018) 2680.
[23]
A.Chilingarian, G. Hovsepyan, G.Karapetyan, and M.Zazyan, Stopping muon effect
and estimation of intracloud electric field, Astroparticle Physics 124 (2021)
102505.
[24] J. Chum,
R. Langer, J.Baše, M.Kollárik, I. Strhárský,
G.Diendorfer , and J.Rusz, Significant enhancements of secondary cosmic rays and
electric field at high mountain peak during thunderstorms, Earth, Planets and Space, (2020) 72.
[25] G.
Diendorfer (2010), LLS Performance Validation using Lightning to Towers, in Proceedings of the 21st International Lightning Detection Conference
(ILDC), vol. 230, pp. 1-15, Orlando, Florida, USA.
[26].
A.Chilingarian, G. Hovsepyan, and A. Hovhannisyan, Particle bursts from
thunderclouds: Natural particle accelerators above our heads, Phys. Rev. D 83,
062001 (2011).
[27]
N.Nikolova, pravite communication, http://www.crd.yerphi.am/adei/
[28]
A.Chilingarian, N.Bostanjyan, T.Karapetyan, L.Vanyan, Remarks on recent results
on neutron production during thunderstorms, Physical Review D 86, 093017,
(2012).
[29]
A.Chilingarian A., A. Daryan, K. Arakelyan, et al., Ground-based observations
of thunderstorm-correlated fluxes of high-energy electrons, gamma rays, and
neutrons (2010), Phys Rev D. 82, 043009.
[30]A.Chilingarian, G. Hovsepyan, S.
Soghomonyan, M.
Zazyan, and
M. Zelenyy, Structures of the intracloud electric field supporting origin of
long-lasting thunderstorm ground enhancements, Physical review 98, 082001
(2018).